
Too Soon?
 Is it too soon to start talking about the Electoral College? With Democratic Presidential candidates still popping up like crocuses and daffodils pushing through snow and a Republican President who has been campaigning since his inauguration, I’d say, “No”. [1]
Who Designed the Electoral College?
The Electoral College is defined in Article II, Section 1, Clauses 2, 3, and 4 of the Constitution of the United States.
- Each State shall appoint, in such Manner as the Legislature thereof may direct, a Number of Electors, equal to the whole Number of Senators and Representatives to which the State may be entitled in the Congress: but no Senator or Representative, or Person holding an Office of Trust or Profit under the United States, shall be appointed an Elector.
- The Electors shall meet in their respective States, and vote by Ballot for two Persons, of whom one at least shall not be an Inhabitant of the same State with themselves. And they shall make a List of all the Persons voted for, and of the Number of Votes for each; which List they shall sign and certify, and transmit sealed to the Seat of the Government of the United States, directed to the President of the Senate. The President of the Senate shall, in the Presence of the Senate and House of Representatives, open all the Certificates, and the Votes shall then be counted. The Person having the greatest Number of Votes shall be the President, if such Number be a Majority of the whole Number of Electors appointed; and if there be more than one who have such Majority, and have an equal Number of Votes, then the House of Representatives shall immediately chuse by Ballot one of them for President; and if no Person have a Majority, then from the five highest on the List the said House shall in like Manner chuse the President. But in chusing the President, the Votes shall be taken by States, the Representation from each State having one Vote; A quorum for this Purpose shall consist of a Member or Members from two thirds of the States, and a Majority of all the States shall be necessary to a Choice. In every Case, after the Choice of the President, the Person having the greatest Number of Votes of the Electors shall be the Vice President. But if there should remain two or more who have equal Votes, the Senate shall chuse from them by Ballot the Vice President.
- The Congress may determine the Time of chusing the Electors, and the Day on which they shall give their Votes; which Day shall be the same throughout the United States.
It was designed at the Constitutional Convention by the Framers of the Constitution.
Why Not Use the Popular Vote?
The founding fathers were afraid of the public. They believed that direct election of the President might allow a tyrant to manipulate the public and win the election. [2] They thought that a small group of electors would be as Alexander Hamilton wrote in the Federalist Papers, “most likely to possess the information and discernment requisite to such complicated investigations“.
Things were a bit different in 1787 from what they are in the 21st Century.
- The population of the United States was considerably smaller. The population counted by the 1790 Census [3] was 3,929,214. The population counted by the 2010 Census [4] was 308,745,538. Our 1790 population was only 1.3% of our 2010 population.
- Population density of the original United States was about 17.2% [5] of what it is today.
- Communications left much to be desired. Horseback was the fastest mode of travel. The U.S. Post Office was officially created on July 26, 1775. UPS didn’t exist until 1919. FedEx began in 1973. The Internet was nearly 200 years in the future.
- You were not allowed to vote if you:
- Did not own property.

- Were a woman.
- Were Black … you were considered 3/5 of a person for Census purposes, but you were “property” for all other purposes.
- Were an Indigenous American … you were considered to be an uncivilized savage.
- Did not own property.
The idea that the widely separated voting population might be ill-informed might be understandable.
The Dispute over Equitable Representation
Just as it is today, there was a wide disparity of size and population among the states at the time of the Constitutional Convention. Different from today was the correlation between a state’s size and its population. Today, the population of the largest state, Alaska, is only 1.4 times the population of the smallest state, Rhode Island. Alaska’s population per square mile is 1.11. New Jersey’s is 1025.44. [6]
The question of representation in the Federal Government became a major source of contention among the members of the Constitutional Convention. Members from large states wanted a state’s representation to be based on population. Believing this would give too much power to the large states, the small states wanted each state to have equal representation. The solution was the Connecticut Compromise. The Congress would be bicameral. Membership in the House of Representatives would be based on population … one representative for every 30,000 people [7] living in the state, but not fewer than one. Membership in the Senate would be equal for each … 2 Senators per state.
10,373 Electoral Votes?
If we were going strictly by Article I, Section 2, Clause 3 of the Constitution of the United States, each state would have one member in the House of Representatives for every 30,000 state residents as determined by the most recent national census. The population numbers of the 2010 Census would set that number at 10,273. [8] Adding Senate representation, membership in the Electoral College would be 10,373. To win the Presidency, a candidate would need at least 5,187 electoral votes.
So why are there only 435 members in the House of Representatives … other than that the U.S. Capitol Building would be a lot less symmetrical? We can thank (or blame) the “Reapportionment Act of 1929“.
In accordance with the Constitution, the number of representatives was adjusted after every 10 year census. The Apportionment Act of 1911 set House of Representatives membership to 433 and provided for adding 1 seat each should Arizona and New Mexico join the union. The next “Apportionment Act” should have been passed in 1921, … but the Republican Congress did not pass the Apportionment Act of 1921 because:
- Many House members would have been redistricted out of their jobs.
- The House chamber could not accommodate the 483 seats that would have been created. [9]
By 1929, there had been no reapportionment for 18 years. The Reapportionment Act of 1929 set the 435 Representatives established in 1911 as the maximum. In 1959, both Alaska and Hawaii became states. Accordingly, 2 seats were added to the House until the next apportionment restored the House to 435 members in 1963. [10]
While the House was adjusting to Alaska and Hawaii, the Electoral College fluctuated accordingly. On March 29, 1961, [11] the 23rd Amendment was ratified by the required number of states. It gave residents of Washington, D.C. the right to vote for President and the minimum 3 electoral votes required by the Constitution. This addition brought the total to the 538 votes that continues into the present.
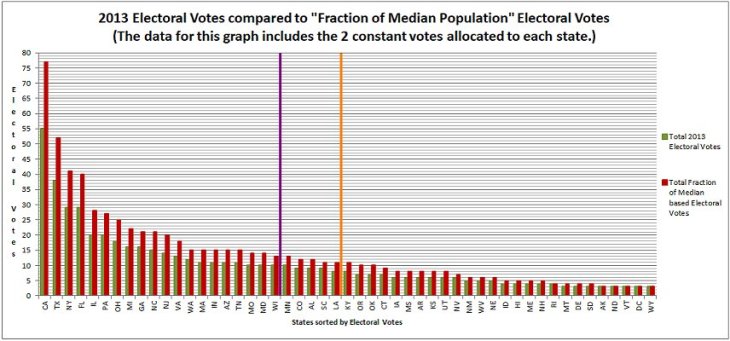
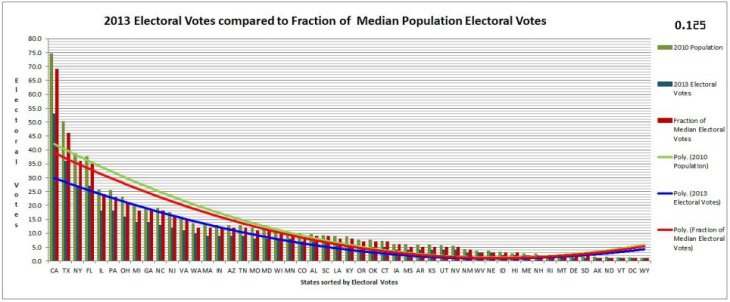
The Reapportionment Act of 1929 solved the problem of membership in the House of Representatives growing to a number that seems totally impractical … but, created a growing representation per person imbalance among the states. Consider this graph.

The dark blue bars show the population of each state. The dark red bars show the number of members of each state’s population represented by each of their representatives [12] … and each of the state’s electoral votes. The red and blue trend lines emphasize the difference between the distributions. These values were set by the 2013 reapportionment based on the 2010 Census. If the Electoral College truly represented the voters, each state’s dark red bar would be roughly proportional to that state’s dark blue bar. Another way of looking at the problem is that each voter in many of the less populous states has more power than each voter in the many of the more populous states because his or her vote is a larger part of the electoral vote in which it is included.
Can the Electoral College be Fixed?
Many believe that the Electoral College should be abolished. Many others believe it’s working just as the Framers of the Constitution intended. [13] Most believe that the Electoral College cannot be changed without amending the Constitution.
- Can the imbalance in electoral representation be fixed?
- Is a Constitutional Amendment the only way to fix the Electoral College?
- Does the Electoral College serve any useful purpose in the 21st Century?
Can the imbalance in electoral representation be fixed?
We could revert to the Constitutional equation of one elector for every 30,000 persons in a state’s population. Of course, California, with a population of 37,252,895, would need a place for 1242 Electors to meet and vote … and would give the House of Representatives 10,273 votes to count. Even with modern technology, that seems a bit unwieldy. We could select a divisor higher than 30,000, but what number? What if we let the decennial census pick the number? What if each state’s number of electoral votes were determined by dividing the state’s population by a fraction of the statistical median of the states’ populations? This graph shows the results.

Like the earlier graph, the dark blue bars show the population of each state while dark red bars show the portion of the state’s population represented by each of their electoral votes. Unlike the earlier graph, the dark red bars are much closer to being proportional to each state’s population. The trend lines representing the distributions’ properties are almost identical. This indicates that the number of people represented by each electoral vote is roughly the same across all states … a fraction of the 2010 median of the states’ populations. The median equals 4,339,367. I used the fraction 0.115, i.e. 11 and a half percent. Therefore, the divisor is 0.115 x 4,339,367 = 499,027 (rounded to the nearest integer).
Why did I use 0.115 as the fraction of the median rather than some other value? The simple answer is because it works. At least, it works well enough to demonstrate the concept. Remember, we’re looking for an integer divisor for state populations with particular properties:
- We want an integer that is derived from the distribution of state populations as determined by the most recent Census.
- We want an integer that is small enough to generate at least one Electoral Vote from the smallest state population.
- We want an integer that is large enough to avoid generating an excessively large number (e.g. greater than 100) of Electoral Votes from the largest state population.
- We want an integer that will generate a distribution of State Electoral Votes with properties that approximate those of the distribution of the States’ Populations.

This is a graph of state populations from the 2010 U.S. Census sorted from lowest to highest population. The orange line represents the mean of the distribution. Using the mean as the population base, would result in 22 states getting zero Electoral Votes. That violates property #2. The red line represents the median of the distribution. Using the median as the population base would still leave 16 states with zero Electoral Votes.
The green line marks 0.115 times the median. That value that gives 1 population-based vote to Wyoming, the District of Columbia, Vermont, North Dakota, and Alaska; 75, 50, 39, and 38 population-based votes to California, Texas, New York, and Florida respectively. [14]
The 2020 census will result in new population figures with a new median. but reapportioning Electoral Votes will remain a matter simple of arithmetic. [15] Using the “fraction of the median population as divisor” method, the total number of electoral votes would increase over time just as it would using the constitutionally defined 30,000. The graph above represents 621 electoral votes. Adding 102 Electoral Votes … 2 for each state and the District of Columbia … would bring the total to 723. A candidate would need 362 Electoral Votes to win.
This is about a 65% increase from the current 438 electoral votes, but we must remember that 438 is artificially low. Had the same method been used after the 2000 census, the electoral votes would have been 675 with 338 for the win. The 2000 to 2010 increase would have been a mere 7%.
Is a Constitutional Amendment the only way to fix the Electoral College?
The imbalance in the Electoral College is a reflection of the imbalance in the House of Representatives. The imbalance in the House of Representatives is the result of the “Reapportionment Act of 1929”. Some would argue that the link between representation in Congress and representation in the Electoral College is constitutionally sacrosanct. Some argued that the “Reapportionment Act of 1929” was itself unconstitutional, but it has never been tested. The 23rd Amendment introduced another disconnect between Congressional and Electoral College representation. It assigned 3 electoral votes to Washington, D.C., but said nothing about Congress. The District of Columbia has no senators and one representative with limited voting privileges. There is Congressional and Constitutional precedent for disconnecting Congressional and Electoral College representation.
Does the Electoral College serve any useful purpose in the 21st Century?
Modern technology allows us to count and communicate the popular vote with relative ease. Do we really need the Electoral College? Perhaps. Remember the Florida Presidential vote recount in 2000? The news and late night comedians made the guy on the left the poster boy for the confusion.
  How about the 2018 Senatorial election recount in the same state? [16] Broward County election supervisor, Brenda Snipes, caught a lot of grief for that one.
Modern technology applied to the popular vote and tied into a national database could eliminate recounts and the need for the Electoral College … except for one tiny problem. Voting Machines can be hacked and databases can be cracked. The only real security measure to protect against such hacking is the very thing that leads to scenes like this … paper backup ballots. Currently, our main protection is a decentralized voting system. Elections are managed at the state and local level.
There is a way that we might use the Electoral College to reduce the need for recounts without increasing the threat of hacking … but the states would need to eliminate the commonly used winner-take-all approach to casting their electoral votes. There are several methods by which states might distribute their electoral votes relative to the distribution of popular votes. Maine and Nebraska already use a variant of the Congressional district approach.
If each state distributed its electoral votes relative to its popular vote, we would almost double the number of our electoral vote samples. In statistics, a distribution of samples approximates the distribution of the population from which the samples were drawn. Increasing the number of samples provides a better approximation of the population. In this case, the electoral votes (samples) would more accurately reflect the popular vote (population). The outcome of the election would be less likely to hinge on so-called “swing states” like Florida. Fewer swing states might lead to fewer recounts and they would seldom be statewide recounts. At the very least, we wouldn’t see and hear so much of the “hair on fire”, “our future in the balance” news coverage about recounts.
What if the Electoral College can’t be fixed?
If the Electoral College can’t be fixed, what are the alternatives?
- We can abolish the Electoral College by amending the Constitution.
- We can trust and encourage our respective states to join the National Popular Vote Interstate Compact.
- We can continue as we have been … with disproportionate power among the states; results hanging on high drama recounts; and the popular vote candidate losing in one out of 4 to 6 elections.
The basic premise of this article is that option 3 is not much of an option. Let’s look at the other two.
We can abolish the Electoral College by amending the Constitution.
This wouldn’t be the first time that an amendment changed something defined in the main body of the Constitution. The 12th Amendment changed Article II, Section 1, Clause 3 of the Constitution, allowing the Electors to vote for a President and Vice President rather than two candidates for President. Henceforth, Presidential candidates would be able to select their own Vice Presidential running mates. Article II leaves it to the states to decide how their Electors would be selected. The 14th, 19th, and 26th Amendments defined and refined who was eligible to vote for Presidential Electors.
A Constitutional Amendment to abolish the Electoral College is legitimate, … BUT amending the Constitution is hard. [17] Article V of the Constitution defines the amendment process. Although either the Congress or a group of states can propose an amendment, the process usually begins in Congress. The typical path is:
- Two-thirds of both houses of Congress must vote for the amendment. That’s 290 members of the House of Representatives and 67 Senators.
- Three-quarters of the states must ratify the amendment. That’s 38 states.
What are the chances of either of those events in today’s political climate? Could we even get 2/3 of each house of Congress to pass a bill agreeing that March 20, 2019 was the first day of Spring in the northern hemisphere? President Trump would tweet that it’s not the “early Spring” promised by Punxsutawney Phil on February 2nd … and his most ardent supporters would decry it as left-wing climate change propaganda.
We can trust and encourage our respective states to join the National Popular Vote Interstate Compact.
Membership in the National Popular Vote Interstate Compact is open to all 50 states and the District of Columbia. All members agree to cast their respective electoral votes to whichever presidential candidate wins the national popular vote. Members will be bound by the compact when the total of their electoral votes equals or exceeds the 270 needed for a win. As of March 2019, 12 states and the District of Columbia have passed legislation to join the compact. The total of their electoral votes is 181 … slightly more than 67% of the required 270.
There’s a chance that the compact could reach its goal in time for the 2020 Presidential election. Both houses of the legislatures in New Mexico and Delaware have passed the compact and are waiting for the signatures of their respective governors. Together those states contribute 8 more votes. Assuming the governors sign, the compact will have 70% of the required 270. It is “in committee” or “passed committee” in at least one legislative house in 19 more states. Three member states have seen the introduction of bills aimed at repealing compact membership. All 3 repeal efforts failed to pass.
Almost since its inception, there has been a running debate about the fairness to all states and/or partisan advantage and/or legality relative to the prohibition on states making treaties defined in Article I, Section 10 of the Constitution. We’re not focused on that debate here. We’re discussing how well the National Popular Vote Interstate Compact (NPVIC) can compensate for weaknesses in the Electoral College.
When the National Popular Vote Interstate Compact becomes effective … and assuming all electors in all member states abide by the agreement …, it will eliminate the major criticism of the Electoral College. The electoral vote will no longer override [18] the popular vote. It also seems likely that there will be several lawsuits following the first time it’s used … especially if, without it, there would have would have been another Electoral College/Popular Vote inversion.
I believe the constitutionality of the compact will be upheld. Oddly enough, I would expect Constitutional Originalists to be its staunchest supporters. The founders of our country did not trust the voters. The Electoral College was to be a buffer between the public and the election of the President. The Constitution has no requirement that a state’s electors must vote as a block nor match the state’s popular vote. In fact, the framers of the Constitution expected the electors to evaluate the popular vote and use their judgement to elect the best candidates. All the statewide winner-take-all nonsense and other restrictions on the electors’ votes came later … created by the states as political parties formed and grew.
The National Popular Vote Interstate Compact does nothing to correct the state-to-state imbalance in the Electoral College. Let’s compare the results of the National Popular Vote Interstate Compact using the “Electoral Votes based on Congressional Representation” model with the compact’s results using the “Electoral Votes based on a Fraction of the Median Population” model.
The dark green columns represent the current “Electoral Votes by Representation” for each state. The dark red columns represent the proposed “Electoral Votes by Fraction of Median” for each state.
The states (x axis) are sorted by population with the highest on the left and the lowest on the right. The orange vertical line marks the approximate median of the distribution. At the time of the 2010 Census, 9 states … California, Texas, New York, Florida, Illinois, Pennsylvania, Ohio, Michigan, and Georgia … were the home of 50.9% of the people in the United States. [19] Using the current distribution approach, the 9 states provide only 44.8% of the electoral votes. Using the proposed approach based on a fraction the of median population, the same 9 states provide 46.1% of the electoral votes. To get to an Electoral College win, we need to add North Carolina and New Jersey. In 2010, 56.9% of the U.S. population lived in these 11 states. They bring the electoral vote up to 50.2% for the current approach and 51.7% for the proposed approach. We have an improvement but there’s still a problem. In “the best of all possible worlds“, 50.9% of the population should be equivalent to 50.9% of the electoral votes.
Getting rid of winner-take-all rules would help to enhance the popular vote/electoral vote balance. Winner-take-all might lead us to believe that the concerns and choices of a state are monolithic. The purple vertical line marks the states that account for 75.6% of the U.S. population in 2010. It adds 11 states to the original 9 … North Carolina, New Jersey, Virginia, Washington, Massachusetts, Indiana, Arizona, Tennessee, Missouri, Maryland, and Wisconsin. With winner-take-all eliminated, a candidate would win if 2/3 of the of the voters in each state voted for that candidate.
Donald Trump won the 2016 Presidential Election with a 77 Electoral Vote margin.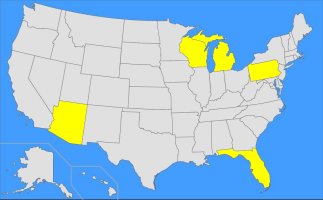 Five states … Arizona, Florida, Michigan, Pennsylvania, and Wisconsin … contributed 86 Electoral Votes. The average margin of the Popular Votes in those 5 states was 1.29%. The sum of the Popular Vote margins was 281,889. Those 281,889 votes … 0.21% of all votes cast made the difference.
Suppose we take away winner-take-all. Using a rough [20] estimate based on Trump’s popular votes in the 5 states, we find that he would have earned only 44 electoral votes. He still would have won by 2 electoral votes, … but only if all other states with winner-take-all had remained unchanged. Applying the same rough estimate to all winner-take-all states, the electoral vote result would have been Clinton 262 and Trump 269 … with the remaining 7 going to other candidates. With nobody getting 270, the Presidency would have been decided by the House of Representatives in accordance with Article II, Section 1, Clause 3 of the Constitution. Because Republicans controlled the House in 2016, Trump would still have been President, but he’d have to work harder to convince most voters that he won on his own.
Neither the proposed Electoral-Votes-based-on-a-Fraction-of-the-Median–Population nor the elimination of winner-take-all would have changed the results of the 2016 Presidential Election on its own. If you apply both, you’d have 723 Electoral Votes with 362 needed to win. To the extent that the combined proposals approximate the popular vote, Clinton would have won … 369 to 354. The combination of electoral-votes-based-on-a-fraction-of-the-median-population and no winner-take-all gives the win to the winner of the popular vote needing neither a Constitutional Amendment nor the National Popular Vote Interstate Compact.
Is it Legal?
We have seen that:
- As the population of the United States increased the one Representative and one Electoral Vote per 30,000 people became unmanageable.
- The Reapportionment Act of 1929 attempted to correct the problem in Item 1 by setting an upper limit on the size of the House of Representatives and the Electoral College.
- As the states increased in population disproportionally, so did the population per Representative / Electoral Vote giving voters in different states different levels of power. [21]
- In 2 of the last 5 Presidential Elections (40%), the winner of the Electoral College lost the national popular vote. [22]
Changing the basis for the number of electoral votes and eliminating statewide winner-take-all would move the Electoral College much closer to its original intent … a reflection of the will of the people tempered by a select body of representatives. Can we do this without having to pass and ratify a new Constitutional Amendment?
Eliminating winner-take-all would be fairly easy. Winner-take-all has no Constitutional basis. It is the result of party politics at the state level. It could be eliminated at the state level. Maine and Nebraska have already done so. While state governments are subject to party politics, partisanship is not quite so deeply embedded in the states as it is in Washington D.C. Public opinion is encouraging states to join the National Popular Vote Interstate Compact. State-level public opinion could stimulate states to pass proportional electoral vote laws. Public opinion in social media and political expedience would push reticent states to follow suit.
Changing the rules for defining the number and distribution of electoral votes would be more contentious. There would be cries of “Unconstitutional” and “Opposing the Will and Wisdom of the Founders”. The “Reapportionment Act of 1929” aroused similar doomsayers, but it became law and has stood for 90 years. If changing the rules on representation in Congress is Constitutional, uncoupling the Electoral College from that representation probably is too.
In deference to the Connecticut Compromise that gives all states exactly 2 Senators but determines House Representatives based on population, we would want to add 2 electoral votes to the number computed by dividing state population by fraction of the median population. We can follow the lead of Maine and Nebraska by assigning those 2 votes to the state’s popular vote winner. Yes, it is a type of winner-take-all. Yes, in states with low populations, the statistical power of the 2 state-wide votes would be higher … that’s how the Connecticut Compromise works … but, it won’t be enough to skew the Electoral Vote far from the popular vote. That statistical skew is, after all, the problem we’re trying to eliminate.
The difficulty for states of equitably distributing electoral votes among congressional districts is more likely to inspire whining than any legal concerns. Our schedule for Federal elections is tied to the biennial elections of the House of Representatives. Federal voting is conducted within the districts of the states’ Congressional Districts. What would we do if the Electoral College and Congressional Districts were no longer aligned?
It seems fairly likely, that states will not want to maintain both Congressional and Electoral districts. The more practical approach will be to distribute virtual Electoral districts across their already existing Congressional districts. This will be more difficult for some states than others.

This graph compares Fraction of the Median Population based Electoral Votes/Districts (dark red columns) to Congressional Districts (dark green columns). The states are sorted by least difference between Proposed Electoral Votes/Districts and Existing Congressional Districts on the left and greatest difference on the right. The mapping would be one-to-one in Alaska, Rhode Island, North Dakota, Vermont, the District of Columbia, and Wyoming. In states entitled to more Electoral Votes Districts than they have Congressional Districts will have to figure out a plan for distributing the “extra” Electoral Votes/Districts. States with fewer Electoral Votes/Districts than Congressional Districts will have the most difficulty. It will require the votes from multiple Congressional Districts to generate each Electoral Vote.
We Have the Technology!
Ironically, there is a two-century old bit of machination in United States politics that may help states to map the proposed system’s virtual Electoral Districts onto the existing Congressional Districts … the practice of gerrymandering. Through most of its checkered history, gerrymandering was a tedious manual process lovingly handled by party flunkies hoping to gain favor with their party’s leaders and, thereby, move up through the ranks.
In this century, the hands working on gerrymandering are 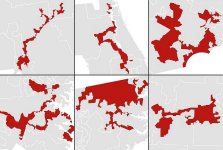 computer algorithms lovingly crafted by entrepreneurs. In minutes, this software can producing convoluted Congressional districts like the “all-stars” on the left. Politicians can now select their voters [23] like never before. Elbridge Gerry would be so proud.
The same algorithms that help political parties gerrymander their way into office again and again could easily be modified to map a state’s virtual Electoral Districts across its Congressional Districts. While they’re at it the state could get rid of any highly gerrymandered Congressional Districts. In 2018, under order of its State Supreme Court, the Commonwealth of Pennsylvania eliminated some of the most gerrymandered Congressional Districts in the country.

What about the House of Representatives?
Why did the Framers of the Constitution tie representation in Congress to representation in the Electoral College? Getting to the Connecticut Compromise had been contentious and difficult. Trying to find another approach for the Electoral College might have been enough to fracture the Constitutional Convention and prevent eventual ratification.
We have already looked at the damage done to both the House of Representatives and the Electoral College by the Reapportionment Act of 1929. We have looked at a proposal for correcting much of the damage to the Electoral College? Would the same fix work on the House of Representatives? Might we realign Congressional representation and the Electoral College while restoring the balance intended by the Connecticut Compromise?
Probably not … at least, not yet. The House of Representatives Chamber has 448 permanent seats. Under the proposed Electoral College plan and using the 2010 Census figures, the Electoral Votes generated by the state-population divided by fraction-of-the-median-population formula would be 621. 173 Representatives would have “standing room only”. With our population growing by over 2.6 million per year, the 2020 Census would be likely to add another 45 to 50 Representatives.
In time, technological and sociological changes may provide a solution. Article I, Section 2, Clause 2 of the Constitution defines the minimum age for election to the House of Representatives as 25. People born in 1994 are eligible to run for and be elected to the House. The first commercial Telepresence company was founded in 1993. Looking at the 2010 demographic breakdown, we find that people from 25 to 29 years of age constituted 6.9% of the U.S. population. Telepresence has existed for all or most of their lives. People below 25 accounted for 34.9% of the population.
By 2030, advanced Telepresence … enhanced by Robotics, Virtual Reality, and Holography … will be as “ordinary” to 34.6% of those who might serve in the House of Representatives as cellphones, compact disks, and cable TV are to those serving now. As time passes, these technologies and, perhaps, others not yet conceived will allow a much larger membership to the House. It may not reach the 10,273 members that the Constitution’s 30,000 people per Representative implies, but it might easily be able to accommodate a fraction-of-the-median-population per Representative model. We may not be able to expand the House Chamber in physical reality, but virtual reality is a really big space.
[ Main Menu ]
End Notes
- President Trump officially filed for his 2020 campaign with the Federal Elections Commission on the day of his inauguration.
Return to Point of Reference
- It’s particularly ironic that, in 2016, it was the Electoral College that allowed a wannabe tyrant to become President while losing the popular vote.
Return to Point of Reference
- In accordance with the Constitution, the first Census was conducted in 1790. A United States Census is conducted every 10 years.
Return to Point of Reference
- In accordance with the Constitution, the most recent Census was conducted in 2010. The next will be conducted in 2020.
Return to Point of Reference
- The 13 original states were not the same sizes and shapes as those sharing their names today.
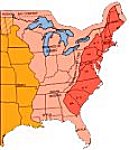 I could not find the original sizes. Using this map as a guide, I estimated the area by adding the present day sizes of the 13 original states, Maine (then part of Massachusetts), and the District of Columbia (then part of Maryland and Virginia) … then multiplying that sum by 0.75. This yielded an approximate area for the original 13 states of 281,029.67 square miles. Given that value, computing the original and current population densities and the ratio between them was straight-forward.
Return to Point of Reference
- I generated these figures from data in two Wikipedia articles:
https://simple.wikipedia.org/wiki/List_of_U.S._states_by_population
and
https://en.wikipedia.org/wiki/List_of_U.S._states_and_territories_by_area
Return to Point of Reference
- When determining a state’s population, each slave counted as 3/5 of a person. Indians (Indigenous Persons) didn’t count at all.
Return to Point of Reference
- With 10,273 members, each representing less than one one-hundredths of a percent of the population for a 2-year term, it seems likely that the members of the House of Representatives would be more concerned with the needs and opinions of their constituents than with affiliations and goals of political parties. That would be unpopular among party leaders. They have a derogatory name for that sort of thing … Representative Democracy.
Return to Point of Reference
- In 1921,
 it may have been possible to squeeze another 48 seats in the gallery, but our population in the 21st Century would require a space more than 20 times as large.
Return to Point of Reference
- The 86th and 87th Congress had 537 members (437 in the House; 100 in the Senate). The 88th Congress returned to 435 members in the House; 535 in total.
Return to Point of Reference
- Until I began preparing this article, I thought the most important thing that happened on March 29, 1961 was that I turned 16 and passed my driving test on that day. (Maybe I still do.)
Return to Point of Reference
- The blue bars show the states’ populations divided by the value 500,000. This scales population numbers between 563,626 (Wyoming) and 37,253,956 (California) down to values that can be shown on the same graph as the numbers of each state’s Electoral Votes.
The red bars show the actual Electoral Votes that are equivalent each state’s representation in the House. These numbers range from 1 to 53.The 2 extra votes that each state gets are not included in the graph. They were not changed by the Reapportionment Act of 1929.
Return to Point of Reference
- When one candidate wins the Electoral College and the other candidate wins the popular vote, it’s fairly easy to predict who opposes and who supports the Electoral College. (This has happened 5 times in our nation’s history; twice since the 2000 election.) When the mismatch occurs, almost all members of the newly elected President praise the Electoral College. Members of losing party, of course, want to abolish it.
Return to Point of Reference
- I selected the “magic” value 0.115 with the help of Microsoft Excel. I created a spreadsheet that used data from the 2010 U.S. Census … the 51 Electoral Vote Units that elect the President (50 States plus the District of Columbia) and their respective populations … and the Electoral Vote values resulting from the 2013 House of Representatives apportionment. (Note: For the rest of this footnote and, indeed, throughout most of this article, I replace Electoral Vote Unit with state.)
I calculated the median population using Excel’s MEDIAN function, then added a pair of cells wherein I could enter a fractional value in one cell and Excel would calculate an Electoral Vote divisor by multiplying that value by the median population. Then, I added another column to the spreadsheet that computed each state‘s new Electoral Vote number dividing the unit’s population by the divisor and rounding it to the nearest integer. Next, I created a graph that displays each state’s 2010 population, 2013 Electoral Vote value, calculated Electoral Vote value, and the trend line of each distribution. (Note: In order to present all 3 values on the same graph, I applied a linear transformation on the population values. Each population bar in the graph represents 1 five hundred thousandth of the state’s population.)
When you enter the value 0.115, the graph looks like this:

Notice that only two trend lines are visible. The red trend line representing the calculated Electoral Votes is covering green trend line that reflects the states’ populations. If you enter 0.105 for the fraction, you get this graph:

The red Electoral Vote line has moved up to reveal the green population line. The fraction 0.105 is too small. The more populous states get too many votes Similarly, a value larger than 0.115 shortchanges the those states:
Remember, only the red line is changing. The trend lines for population (green) and the 2013 Electoral Votes (blue) are the same in all 3 graphs.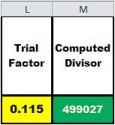 If you want to download the spreadsheet for your own experimentation, click on this link: Electoral Vote Calculator. Look for these cells in the upper right corner of the page labeled “Electoral Votes Data”. The yellow cell (L2) under the title Trial Factor is the one to change. After changing the value, look at the page with the title “Electoral Votes Graph”. Try several values and enjoy yourself.
When the 2020 Census figures are released, we can replace the population figures in column B with the new values and determine a new set of “Fraction of Median” based Electoral Votes within minutes.
Return to Point of Reference
- Because it must distribute a fixed number of electoral votes (and House members) based on variable population figures, the currently used method of equal proportions is more complicated. Until we build a House Chamber with expanding walls … or grow smaller members of Congress …, that method will still be needed to redistribute the 435 House seats.
Return to Point of Reference
 I wonder whether there’s something in the water in Florida … besides alligators?
Return to Point of Reference
- The 27th Amendment was passed by Congress on September 25, 1789. It reached the required ratification of 3/4 of the states when Missouri ratified it on May 5, 1992, 202 years, 7 months, and 10 days later.
Return to Point of Reference
- At first, without thinking about the obvious pun, I almost used the phrase “will no longer trump the popular vote” rather than “will no longer override the popular vote”. I reconsidered my wording.
Return to Point of Reference
- Obviously, population density in the United States is an extremely skewed distribution. More than half of our population lives in 17.6% of the states. Interestingly, the 9 states are reasonably well-dispersed geographically … with 1 on the West Coast, 1 in the Southwest, 2 in the Southeast, 3 in the Northeast, and 2 in the Midwest.
Return to Point of Reference
- The rough estimate was generated by multiplying each state’s electoral votes by the percentage of the popular vote that Trump won in that state, then rounding up to the next whole electoral vote. A more precise method would be to add the electoral votes for all Congressional districts won by Trump in the 5 states. That level of precision wasn’t necessary to making the point.
Return to Point of Reference
- Based on the 2010 Census, each Electoral Vote in Rhode Island represented 526,284 people while each Electoral Vote in Montana represented 989,415 people. It took roughly 2 Montana citizens to have the same influence in the 2016 Presidential Election as 1 Rhode Island citizen.
Return to Point of Reference
- I was tempted to say something like, “In 40% of the Presidential Elections in the 21st Century, the winner of the Electoral College lost the national popular vote”, but that would have been disingenuous. Although all of George W. Bush’s presidency was in the 21st Century, he was elected in the last weeks of the 20th Century. Taking advantage of the general public’s ignorance of how our calendar works seemed unfair.
Return to Point of Reference
- Reminder … it’s supposed to be the other way around. The voters are supposed to be selecting the politicians who will represent them.
Return to Point of Reference

One thought on “The Electoral College”