Half of the Dozen
Julian Castro suspended his campaign on January 2, 2020. Marianne Williamson dropped out on January 10, 2020. Cory Booker announced the end of his campaign on January 13, 2020. Twelve Democrats remain in the race for their party’s Presidential nomination.

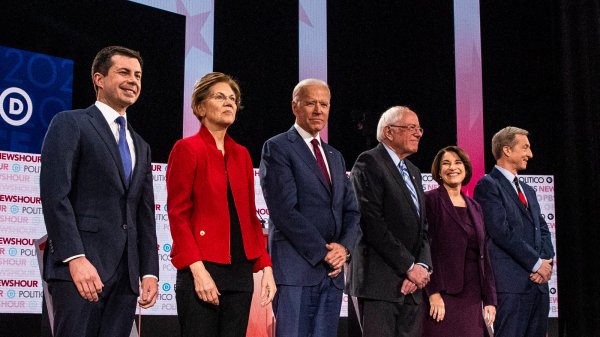
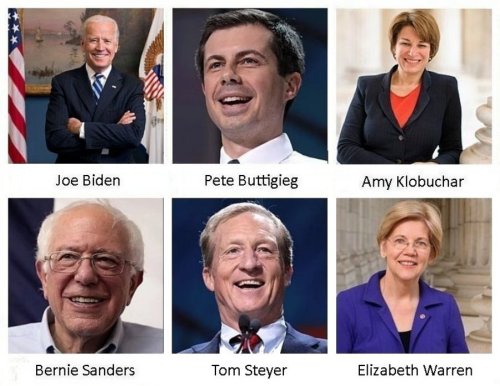
Three of those remaining are late entries. Two actually have the kind of wealth that Donald Trump pretends to have. Six qualified for the January 14th debate in Des Moines, Iowa.
Keeping Score
I watched the debate and kept score based on my less than humble opinion. I watched a couple hours of analysis following the debate and kept score based on the opinions of the commentators. I located and merged the results of the latest Iowa and New Hampshire poles. Since May 1, 2019. I’ve been keeping track of all[1] of the Presidential candidates, selecting one at “random”,[2] and giving that candidate one point.[3]
My less than Humble Evaluation
By my tally, the candidates’ performances ranked like this:
- Elizabeth Warren
Elizabeth seemed most in control of the debate. She was able to handle whatever questions were directed at her. Her experience as a college teacher and her extensive plans for dealing with our nation’s problems were apparent. She lost points during her altercation with Bernie Sanders.
- Joe Biden and Amy Klobuchar tied for second place.
Joe adequately handled the questions directed at him, but didn’t display the same level of energy he did in the December debate.
Amy matched Elizabeth Warren’s command of the situation, but seemed incapable of fitting her responses into the time allotted for responses. She had to be reminded by the moderator that her time was up on almost every question … often several times on a single response.
- Pete Buttigieg
The more time Pete has to talk in one of these debates, the less impressed I am with his performance. I think that part of the problem is that these events are not true debates. They’re really “two hours of moderators asking questions”, but that’s not a title likely to attract viewers. Pete did better in the earlier events when the limited time per candidate forced a more debate-like give and take.
- Tom Steyer
As my readers know, I’m not one of Tom’s fans, but he did make some good points in this debate. His presentation was incredibly stiff. He seemed to be reciting his answers rather than simply expressing his views. His lack of experience in up-front[4] politics showed.
- Bernie Sanders
For me, Bernie lacks specifics. His ideas are great, but I’d like to hear more about how he plans to get us from where we are to where he wants to lead us. To his credit, he was more specific about the tax increases that will be needed to support “Medicare for All”. Bernie lost the same number of points as Elizabeth Warren for his part in their “disagreement”.
Latest Iowa and New Hampshire Polls Combined
Here are charts showing the results of the polls for Iowa and New Hampshire from the week ending on January 25th. [5]
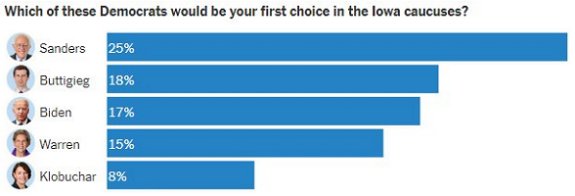
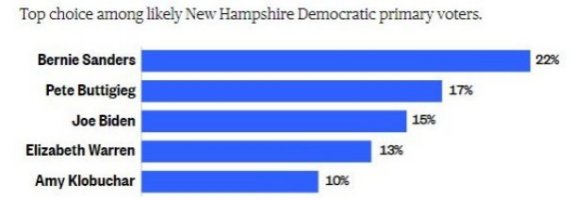
When combined, these polls produced this ranking of the candidates:
- Bernie Sanders,
- Pete Buttigieg,
- Joe Biden,
- Elizabeth Warren.
- Amy Klobuchar, and
- Tom Steyer.
The Correspondents and Pundits
I listened to couple of hours of post-debate discussion on MSNBC and, did my best to tabulate the pros and cons expressed by the discussion participants. Sometimes it was a bit hard to follow (as open-ended discussions sometimes are). The resultant ranking was:
- Bernie Sanders and Elizabeth Warren tied for first place,
- Joe Biden and Tom Steyer tied for second, and
- Pete Buttigieg and Amy Klobuchar tied for third.
Random Fluctuations in the Universe
Two hundred and seventy-two days (as of January 28th) of random selections for President yielded these results:
- Amy Klobuchar,
- Joe Biden,
- Pete Buttigieg,
- Bernie Sanders,
- Elizabeth Warren, and
- Tom Steyer.
To Sum It All Up
Adding the scores (not the rankings) across all tabulations produces this ordering:
- Bernie Sanders
- Elizabeth Warren,
- Joe Biden,
- Pete Buttigieg,
- Amy Klobuchar, and
- Tom Steyer
What Does It All Mean?
What does it all mean? It means that I’ve presented four “opinions” of the state of the Democrat’s presidential race and an amalgam of all four … that will probably have little correlation with the results of either the February 3rd Iowa Caucuses or the February 11th New Hampshire Primaries. The real question is: What makes it so difficult to estimate the results of a vote that will be held in less than a week and another vote less than a week after the first one?
I Thought I Made a Mistake Once, … But I was Wrong!
This article is my opinion; not my science. [6] There are some basic problems that plague predictions based on opinions and the statistics applied to those opinions:
- Expressed opinions often differ from actual opinions.
There are a lot of “people-pleasers” among us. There are a lot of conformists among us. There are those among us who fear controversy. For these reasons and more, many people approached by a pollster may not want to outright refuse to respond, but are uncomfortable with answering with complete accurately … especially if the subject of the poll is politics.
One who lives in a very liberal community might be reluctant to claim support for a more conservative opponent. Friends and relatives who are hunters or sport shooters might not understand that your opposition to the NRA is about it being too beholden to gun manufacturers. In either case, one might temper one’s responses or, simply, refuse to participate in the poll.
- Often, opinions polls are not really random samples.
Participants in polls are self-selecting. You cannot be forced to participate. Whether the pollster is on the phone, at your door, in the street, or online, you can choose to participate or decline. Polls cannot truly represent everyone because some of the “everyones” refuse to play. The best that can be done to compensate is to collect very large samples … or combine smaller samples.
- Small samples sizes do not generally produce reliable results.
My less than humble evaluation above is an extreme example. That sample has no degrees of freedom. If you remove my opinions from that segment, there is no segment. To better understand “degrees of freedom” consider this example:
Suppose I show you a box that contains two marbles … one black and one white. I ask you to guess the color of the marble you will pick from the box without looking. You have a 50-50 chance of guessing correctly. Let’s say you pick the black marble. Without putting the black marble back in the box, I ask you to guess the color of the next marble you will pick.
Did you guess correctly? 😉 Of course, you did. The chance of it being the white marble was 100%. At the beginning of the exercise, your guess had one degree of freedom. Either black or white might have been correct. On the second selection, you had no degrees of freedom (assuming you wanted to guess correctly). The only choice was the white marble.
The larger the sample is; the more likely it will represent the the population of which it is a part. If the box had 99 black marbles and one white marble, it would require between one and one hundred selections to find the white marble. If, when you found the white marble, you noted the number of marbles selected; put all the marbles back in the box; and repeated the experiment many, many times, the average value of the number of selections needed to find the white marble would approach 50 … providing the tedium didn’t cause you to “lose your marbles” first. 😲
- Statistical analyses always have a margin error that can exceed … and, therefore, obscure … the differences within a sample.
If you listen to or read poll results with any regularity, you’ve probably heard the term “margin of error”. The margin of error is an estimate of the probability that the poll does not represent the majority of the population. [7] If two candidate’s “scores” differ by less than the margin of error, we cannot be sure whether the difference is real or simply a statistical anomaly.
Keeping Score … within the Margin of Error
Let’s look at my earlier “score cards” in the light of each sample’s margin of error. In keeping with the practices of the social sciences, I used the .05 level of significance. Politics is, after all, one of the social sciences.
My less than Humble Evaluation … within the Margin
This distribution has a margin of error of 4.90. Taking that into account, the differences among the candidates narrow to:
- Elizabeth Warren and Joe Biden tied for first place,
- Amy Klobuchar and Pete Buttigieg tied for second place,
- Tom Steyer, and
- Bernie Sanders.
“Latest” Iowa and New Hampshire Polls Combined … within the Margin
The sample formed by combining the polls shown above has a 10.34 point margin of error implying that:
- Bernie Sanders, Pete Buttigieg, and Joe Biden are in a dead heat, followed by,
- Elizabeth Warren,
- Amy Klobuchar, and
- Tom Steyer.
The Correspondents and Pundits … within the Margin
This sample has a low margin of error … 2.15 … and, its results are unchanged. Because this is a very small sampling, the tri-modal pattern of results not only overcomes the margin of error; it creates it:
- Bernie Sanders and Elizabeth Warren remain tied for first place,
- Joe Biden and Tom Steyer remain tied for second, and
- Pete Buttigieg and Amy Klobuchar remain tied for third.
Random Fluctuations in the Universe … within the Margin
You might expect a sample of “random” numbers to have a rather large margin of error. That would be true if the sample were large enough. [8] This sample is not a large one. My random tallying program covers all of the remaining candidates … both Democrats and Republicans …; not just the 6 who debated in January. Those 6 candidates represent only 44.1% of my random candidate “tracking”. The margin of error for this sample is only 3.71. When added to the analysis it produces these results:
- Amy Klobuchar and Joe Biden,
- Pete Buttigieg and Bernie Sanders,
- Elizabeth Warren, and
- Tom Steyer.
To Sum It All Up … within the Margin
The combination of all 4 samples produces a larger margin of error than any of the individual samples … 12.17. One would expect such a large margin of error to wash out most of the differences among the candidates. That’s exactly what we see. Within the margin of error:
- Elizabeth Warren, Joe Biden, Amy Klobuchar, Pete Buttigieg, and Tom Steyer are essentially tied and,
- Bernie Sanders stands alone.
That’s not very helpful, is it?
Again, What Does It All Mean?
I believe it means that the Democratic Presidential Race is very close …. probably, and not surprisingly, too close to call. It’s just too early. A new poll seems to come out somewhere every day. For the most part, these polls consider only the “January 6”. Although the correspondents and pundits have been expending most of their energy on the Senate Impeachment Trial for the past couple of weeks, we see a similar ebb and flow in their discussions when they do talk about the Presidential Race. Because of the debate access rules of the Democratic National Committee, one prominent candidate, Michael Bloomberg, has not been allowed to debate yet, but is still gaining on the 6 who were in the debate.
Bringing It Into Focus
When will we know who the Democrats will nominate for President? That’s easy. We’ll know for sure sometime between Monday, July 13th and Thursday, July 16th. That’s when the Democrats will hold their National Convention to nominate their candidate. In a bit more than a month, we should see a narrowing of the field of candidates:
- The Iowa Caucuses will be held on Monday, February 3rd;
- Tuesday, February 11th is the date of the New Hampshire Primary;
- Nevada will hold its caucuses on February 22nd;
- The day of the South Carolina Primary is Saturday, February 29th; and
- March 3rd is Super Tuesday, the day when Alabama, Arkansas, California, Colorado, Democrats Abroad, Maine, Massachusetts, Minnesota, North Carolina, Oklahoma, Tennessee, Texas, Utah, Vermont, and Virginia will all hold their presidential primaries.
By the end of Super Tuesday, we’ll know the preferences of the voters in 18 states. By then, national polls should have fewer candidates and smaller margins of error.
From July 17th through November 3rd
The so-called “only polls that count” in selecting the Democratic nominee … the primaries and caucuses … begin tomorrow. No matter who comes out of the Democratic National Convention must really get to work on Friday, July 17th. Whether by intent, or wanton ignorance, or sheer stupidity, the Trump Administration is attacking the very basis of our country, our freedom, and the rule of law … the Constitution of the United States. All of the Democratic candidates will need to shift their priorities to getting their party’s nominee elected on Tuesday, November 3, 2020. That nominee needs the support … and the vote …of every anti-Trumpist in the nation regardless of party affiliation.
[ Election 2020 Sub-Menu ]
[ Main Menu ]
End Notes
- As of the evening of January 17, 2020, there are 15 nationally declared candidates for the office of President of the United States … 12 Democrats and 3 Republicans (including President Trump).
Return to Point of Reference
- I put the word “random” in quotes because I generate the daily selection using a random number generator available in Windows 10 command language. As anyone who has taken even a few courses in computer science knows software algorithms generate pseudo-random numbers rather than true random numbers.
Return to Point of Reference
- Yes, I know this sounds like total nonsense, but I contend that the day to day fluctuations of public opinion are little more than random fluctuations of the Universe … especially at this point in the campaign. I know that I should give President Trump much more weight than the other two Republicans, but that would mean that I’d have to raise the sum of the weights of the Democrats to match Trump weight + 2. Figuring out that algorithm and coding it in a Windows command language *.BAT file is too much like work. In time, there will be only 2 candidates anyway.
Return to Point of Reference
- Tom Steyer has done a lot of good work between leaving his business career and his run for President. That work (and growing his business) show that he has skill in planning and engaging others in those plans. It’s not clear how far that can go as the up-front man
 for the Executive Branch of the Federal Government. There can be little doubt that he has more presidential qualities than Donald Trump, but all 12 Democrats, both of the other Republicans, … and the average rock … have more presidential qualities than Trump.
Return to Point of Reference
- Tom Steyer is not shown in the graphs. He earned 3% in each.
Return to Point of Reference
- Predicting election results with random numbers? Really? We all know that U.S. voters make their candidate selections by getting as much information as possible and making rational judgments based on that information. Right? The only way a sample of random numbers could predict election results is if most voting were based on emotions, single issues, and/or believing outright lies. If that were true, we get a bickering Congress and an incompetent President.
Return to Point of Reference
- Although it may seem odd to most (and requires a double negative to say), the way you conduct research is by disproving that there is no significant (i.e., real) difference among the observed values of the entries in a sample. This lack of difference … what the researcher is trying to disprove … is called the “null hypothesis”. If the researcher’s statistical analysis shows that the values of the entries are not likely to be just random variations, the researcher can reject the null hypothesis. There’s a high probability that the differences among the results are real. Here’s an example:
Suppose you are a researcher who believes that practicing related problems improves a subject’s ability to solve that type of problem, i.e. practice leads to learning. To test your theory, you decide to test whether practice helps mice learn to solve mazes. (The mice seem happy to participate. They can smell a treat that you’ve placed at the end of each maze.)
You divide your mice into two groups of equal sizes. One group (the experimental group) gets “maze practice” every day for a week. The maze is different at each practice session. The other group (the control group) gets no maze practice. At the end of the week, you give both groups the same maze to solve; noting the time each mouse requires to locate the treat. When you average the times for each group, you see that the mice in the experimental group have the lower average time. The average mouse in the experimental group solved the test maze more quickly than the average mouse in the control group.
The practice helped, right? Maybe; maybe not. Maybe, just by chance, most of the mice in the control group were “having a bad day”. You have to use statistical analysis of your data to decide whether the difference is real. You “crunch the numbers” and learn that you would see this much difference less than 5% of the time. (This is called “significant at the .05 level. The .05 level of significance is typically used for “experiments” in the social sciences.) Since your analysis shows that the observed results would occur by chance only 5% of the time, you feel comfortable rejecting the null hypothesis (no difference between the groups) and publishing your results … Practice seems to help mice to learn to solve mazes … perhaps implying that practice may improve learning in general.
Of course, many different kinds of experiments would have to show similar results before most members of the researchers field would agree that practice facilitates all learning. An important point missed by most members of the public is that good science is never absolute. Any theory is only true until new insights come to light and are tested. Until then, we can say that there is a very high probability that the theory accurately portrays “reality”.
If you want to learn more about Margin of Error and/or Hypothesis Testing, click on the link(s) in this sentence.
Return to Point of Reference
- A larger list of pseudo-random numbers would probably have a larger margin of error, but it cannot be too large. The algorithm that generates the numbers will repeat after a very large sequence of numbers.
Return to Point of Reference

10 thoughts on “Election 2020 #3”